
Insights
The Shifting Bottleneck Conundrum: How AI Is Reshaping the Software Development Lifecycle
The impact of AI: Real gains or shifting bottlenecks?

Flow Engineering is the science of creating, visualizing and optimizing the flow of value from your company to the customers. It addresses the million-dollar (likely more) challenge of most product companies is: How do we create value in the form of product and services and ship this value to our customers as quickly, sustainably and frictionless as possible.
From a product management point of view, we might look at how quickly we can achieve customer adoption and satisfaction. From an engineering platform point of view, we might look at DevOps metrics such as DORA, which have a similar aim. And from a software development point of view, we might look at code quality and number of features shipped. All these different viewpoints have something in common: we want to measure and optimize the flow from our ideas to implementation and product delivery.

Flow engineering is a modern approach to see value delivery as a flow from inception to outcome. The goal is to have the flow to be as wide and unobstructed as possible for it to deliver the maximum value.
To optimize the flow, it helps to visualize our internal engineering and delivery flow. On top of that, we like to understand our current capabilities to see where the bottlenecks are and where we can make cost effective improvement
For measuring software delivery capabilities, it helps to focus around a few North Star metrics, that capture our capabilities as well as impediments. These flow metrics are:
Velocity: The speed at which we are delivering. How quickly can we ship a feature? How long is our so-called cycle or lead time from start to finish? The shorter our lead time, the faster is our delivery (Learn more about cycle time).
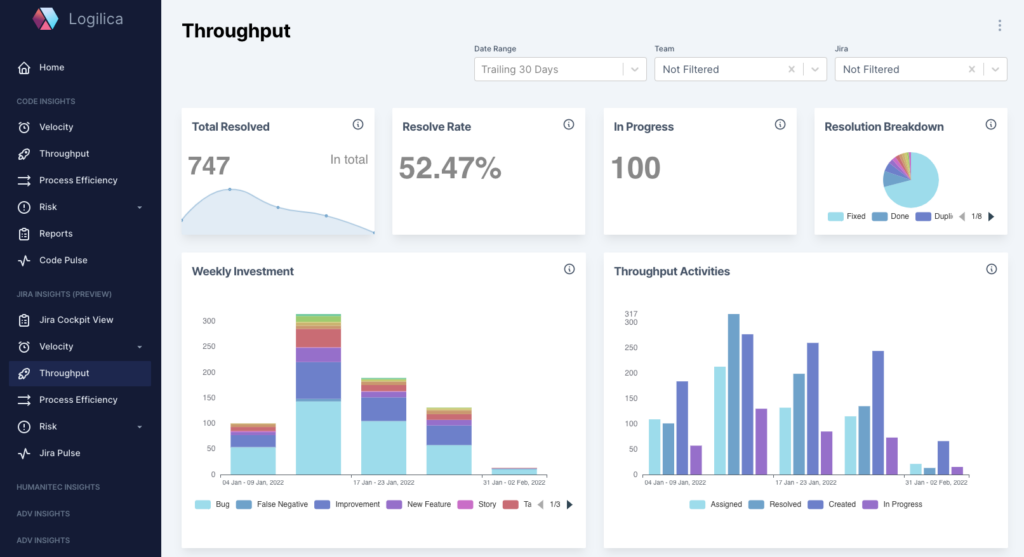
Throughput: The amount of work can get done. How many features do we ship in a quarter? How many releases do we do in a week? How many tickets can we resolve? Throughput signifies our current rhythm in terms of delivery and its capacity; the maximum number of items we can get done in the current setting.
Flow Efficiency: How much waste or friction do we encounter? For instance, how much unplanned work are we doing? How many bugs do we have to resolve due to poor quality? How often does the released product need patching and how quickly can we do this? How often do we bypass approval processes or skip expected reviews?
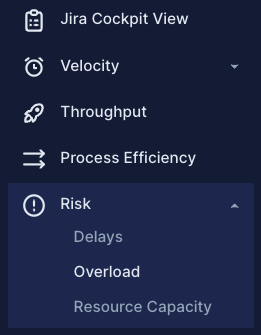
Flow Risk: What are impediments to deliver smoothly? Do we plan more items than our capacity allows? Do we overload teams? Do we have process hiccups leading to delays? Do we have too many context switches reducing the overall effectiveness? Do we do too much unplanned work leading to frustration and confusion?
Flow engineering can be compared to a stream of water from its source (us) to the ocean (the customer). We prefer a wide, fast flowing, unobstructed and clear stream that provides a clear passageway from the source to the ocean.
For us to improve the flow of software delivery to the customer, we not only need to align engineering with the business, but we also need to reduce friction within our own systems. We can only do that if we can measure our current state. Fortunately, in modern software organisations there a many data points that can be captured automatically to generate a wholistic picture.
Most companies run some form of agile software delivery process. This might be running agile Scrum teams, having a Kanban process or running agile at scale using SAFe. Typically, this is underpinned by DevOps infrastructure that handles our feature planning, software development and build processes as well as our test and release tools.
All this generates large amounts of information. For instance, each code change tells a story about what changed, where something changed, how long the change took, and who was involved in each step. The meta data of the change include details of whether that code change was reviewed, who was involved in reviewing, and how many iterations it took for it to be approved and merged. Additionally, we easily get supplementary DevOps information: the duration and success of a build; the corresponding test coverage details; and the resolution times of feature or bug tickets.
Most organisation already have valuable data coming from:
The key to success is to extract that data from the different engineering tools and silos, fuse the data and apply smart domain-specific analytics to generate flow insights to optimize and manage the end-to-end delivery process.
Logilica helps engineering managers to get insights for decision making by connecting to many of the data sources seen above, fusing the data, and computing metrics and insights automatically. Those metrics can then be sliced and diced by engineering leaders, and drilled down into evidence. This enables an open, data-driven team culture for making more informed and collaborative decisions.
Flow metrics are a core concept supported by Logilica and extensively used by software delivery teams and agile engineering groups to deliver sustainable value faster. The flow metrics are balanced across different sources around three core pillars:
Centring flow metrics around the core pillars ensures the ability for a balanced approach that does not favour one-sided extremes, such as focusing excessively on delivery cycle times, resulting in neglecting the process and the burnout of team members.
Matching the three core pillars with the flow metrics provides a consistent and flexible mental model across the engineering organisation and beyond.
Software delivery is a complex journey and some for of metrics are essential to keep tracking and optimising the process. However, no single metric will solve it all and such it is much better to centre metrics around the right concepts than single values.
Flow engineering is a thriving discipline that focuses and velocity, throughput and risks to rally everyone's thoughts around smooth, fast, and reliable delivery.
Logilica helps engineering leaders to automate capturing flow metrics. Speak to one of our friendly team members, who can walk you through the Logilica platform to see if we are a good match for you. Our SaaS platform is free to sign up and you can get started in as quickly as 15min to see your own engineering flow metrics!


.jpeg)