
Insights
The Shifting Bottleneck Conundrum: How AI Is Reshaping the Software Development Lifecycle
The impact of AI: Real gains or shifting bottlenecks?

The President of the USA has a 100 days to prove himself. You only have 90 if you have taken over a new leadership position. If you can’t build a suitable positive new momentum during this time, there might be hard work ahead of you or your leadership might even be doomed to failure. -- The First 90 Days: Proven Strategies for Getting Up to Speed Faster and Smarter
New development leaders have a lot to learn: business problems, technology, processes, team dynamics. It is easy to get engulfed in them and lose track of the main goal - deliver result. Software development process can seem a bit opaque. Sometimes features and bug fixes appear to be delivered without your intervention. However delivery may slow down, because you did not intervene to remove blockers such as:
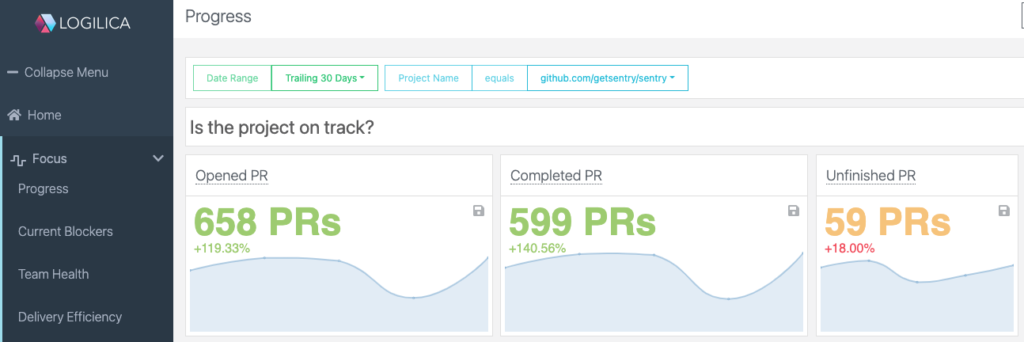
How to know whether you need to intervene or focus on other more important things? Most of the time it depends on whether software is delivered with a healthy momentum. These three pull request metrics can help you to see the big picture.
A pull requests is opened when a contributor publishes code changes for a task. Published changes can be either a first draft ready for review or first step showing intentions (often with WIP in title). Opened pull requests indicates that planning was complete and tasks are ready to be executed. If the Opened Pull Requests count is above average, then your teams planning capacity is healthy. However, warning signs are when you observe downward trends or erratic fluctuation of large scale. Planning Capacity could be affected by:
There is no single ideal number for open pull requests, but seeing this as number of concurrent tasks that your team is handling, gives you some good idea if they are overloaded or blocked by other tasks.
A pull requests is completed when the publishes code is integrated or abandoned. Completed pull request is an approximation for feature/fix throughput. The delivery is roughly on-track if the Completed Pull Requests count is around average of even upward trending. Factors affecting throughputs are:
Early warning signs are when completion rates are erratic or have a downward trend. It is important to investigate the causes and drill down further. Is completion blocked by review bottlenecks? Are reviews done in bulk without actually doing them, showing up as sudden spikes? If completion rates go up, are they at the cost of other indicators such as lack of cooperation or quality?
Unfinished Pull Requests are neither merged nor closed. They represent ongoing work. The healthy range for unfinished pull request is between 1x - 2x per contributor. People start new work to stay productive if they cannot finish their current work. However, spreading too thin runs the risk of not meeting deadlines or compromising quality. Work could be blocked by:
As above, it is important to look at the underlying causes. We mentioned reviews and review blockers. Another indicator are excessive review cycles or a single person who become the bottleneck for approval. Other indicators might come from infrastructure such as slow builds or broken builds. Drilling into more data helps to solve these issues and prevent team frustration.
These metrics are good for giving you a rough gauge of delivery. They are not good for performance reviews. If people know you are using them to judge their performance, they could start gaming the system by breaking tasks into multiple pull requests or hoarding completed work. These metrics are good to tell you when to start a conversation but not good to judge individuals.
The best approach is to improve team work and decide as a team what are good indicators to keep an eye on. Oftentimes, team member can use those indicators as evidence for bringing up issues and drive positive change. Each individual developer might not see issues creeping in, but looking at the bigger productivity can be unlocked and team morale improved.
The Logilica Insights performs deep data analytics on your repository information and aggregates the key insights into continuously updating dashboards. This frees up development teams from manual investigations and home-grown scripting that are costly to maintain. At the same time everyone reaps the benefits.
Moreover, Logilica Insights allows to drill down into the related aspects as outline above to investigate the broader reasons and to making evidence-based decisions. Logilica Insights is structured around work streams, which groups activity objectives together.
The "Focus" work stream give you near real-time insight of how the project is going. The "Progress" dashboard gathers these above 3 indicators and many others in one place and compares them with historical values. By checking the "Progress" dashboard regularly you can be assured the team is delivering value or be alarmed the team might need your help. All done in seconds.


.jpeg)